Table of Contents
Milestone!
June 3rd 2008, shortly before 1 pm, the job with JOBID 100,000 was completed.
| JOBID | USER | STAT | QUEUE | FROM_HOST | EXEC_HOST | JOB_NAME | SUBMIT_TIME |
|---|---|---|---|---|---|---|---|
| 100000 | ztan | DONE | imw | swallowtail | compute-1-23 | ising-spring-2008-swt/simpleRuns/data018/t0.900000/mu-2.630000 | Jun 3 12:48 |
Cluster Usage
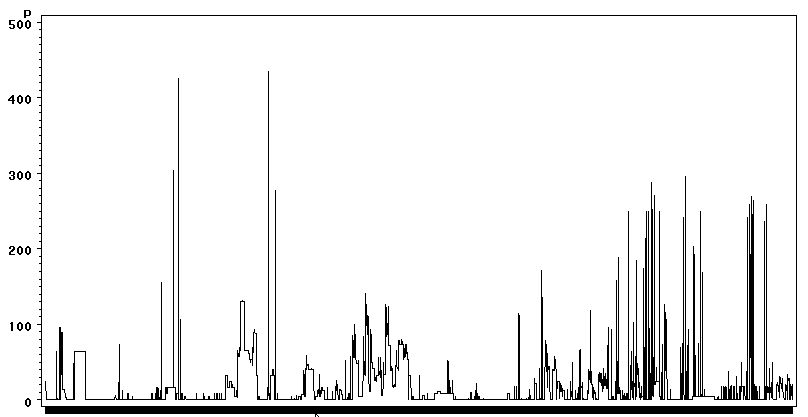
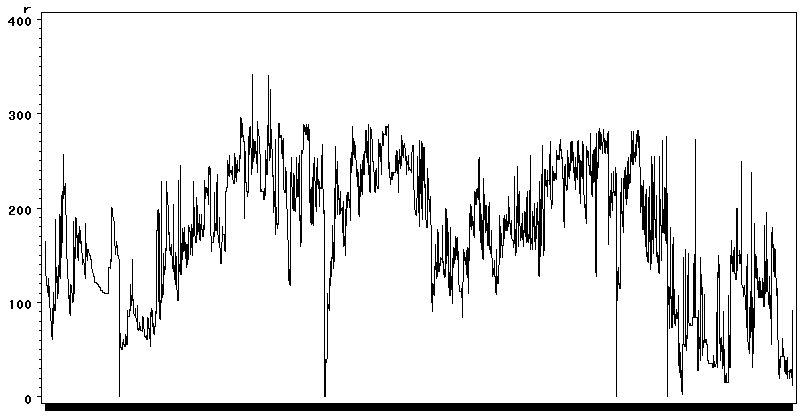
Below are some graphs covering the time period 7/27/07,17:15 to 05/22/08,15:00 sampled every 5 min intervals.
- Pending Jobs
- Running Jobs
The maximum running jobs is 288 (total cores/job slots). The peaks beyond that threshold represents our experimentation with overloading the job slots.
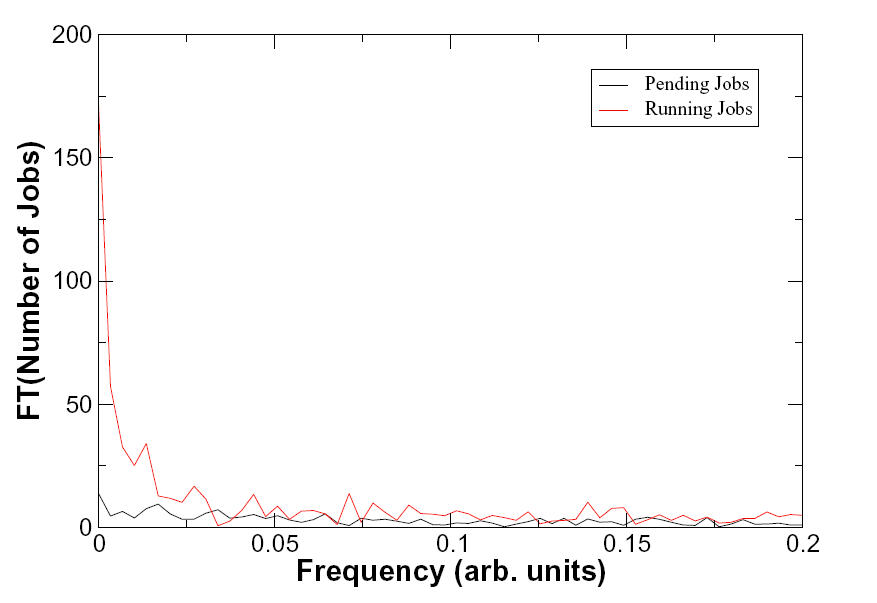
Fourier
Francis report … mathematically, a Fourier transform is:
F(w) = Integral ( f(t) exp(i*w*t) dt)
That is, you integrate a function (or data) with a complex exponential, which is just a sum of sine and cosine functions.
Practically speaking, suppose f(t) was something like position as a function of time. Fourier transforming will reveal if there are characteristic frequencies of the data. For example, if the f(t) was the position of the pendulum in a clock over time, the Fourier transform would show a huge spike at the frequency of the motion, 1 Hz.
So Tom is wondering if there are some characteristic frequencies hiding in this usage pattern … here is the result:
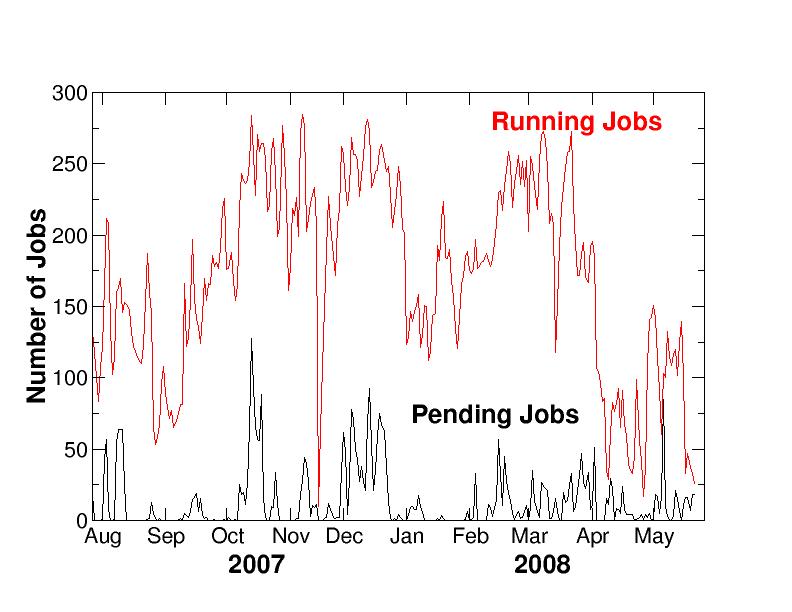
Mean
This is the MEAN number of jobs running/pending over each day. Averaging over the day eliminates some of the extreme peaks, and gives a good idea of daily usage, … here is the result:
Other Stats
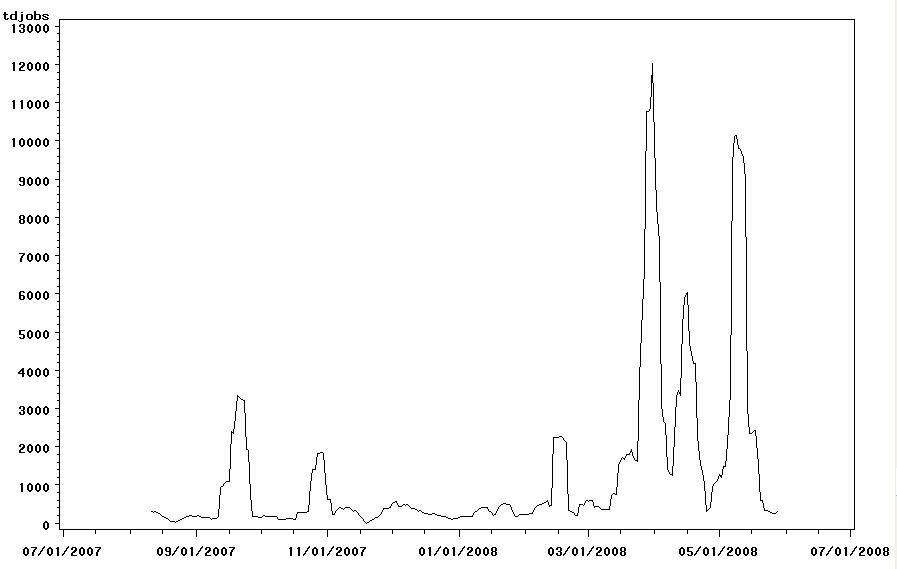
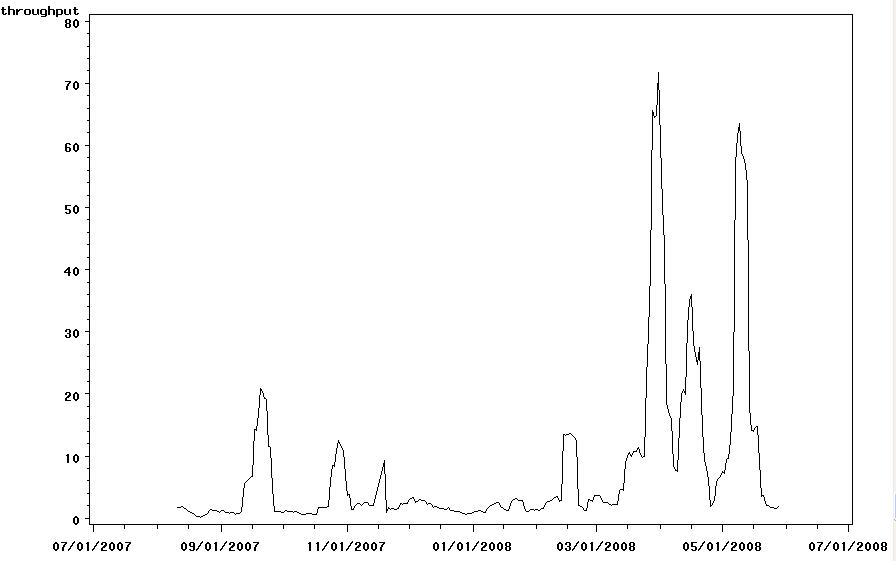
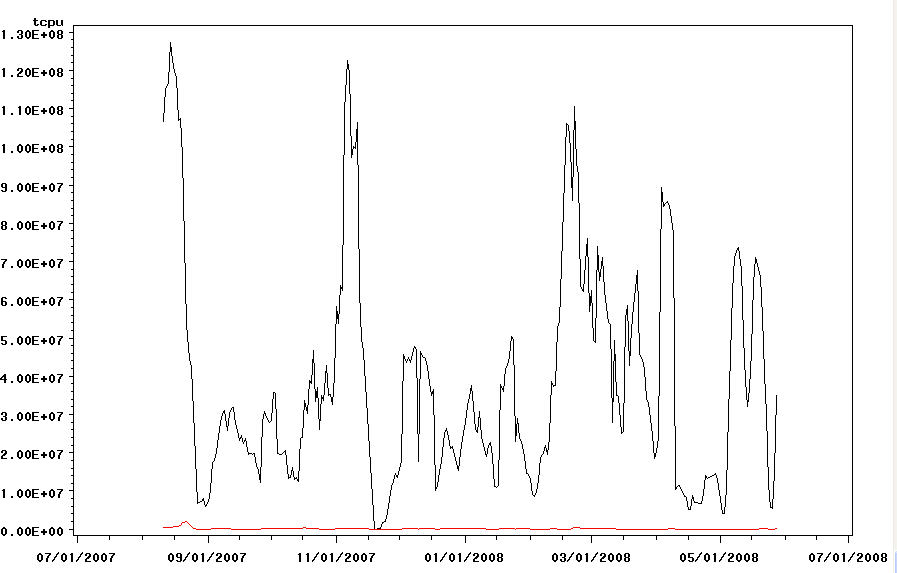
These graphs reflect data that is polled daily. Each day, the stats are calculated that reflect the activity during the last 7 days, for all users, and refer only to jobs whose status is DONE. The last 7 days of data is thus a shifting “weekly” measure; ie not weekly data.
Below is the graph for the total number of jobs processed. Below it is a measure called throughput; it reflects the jobs/hour processed. The final graph is the total cpu consumed in seconds.
