Table of Contents
Overloading Job Slots
Typically, in a particular configuration file, you define how many “cores” a node has. This is then equated to “job slots”. In a default scenario, the number of cores and job slots are equal. The assumption behind this is that each job contains a task that will consume all resources available to that core.
We have dual quad core nodes implying 8 cores per node. These 8 cores have access to 4 GB or memory. The scheduler with thus challenge up to 8 jobs to such a host. Without any other parameters, one then hopes that each job can utilized the CPU to near the 95% threshold and obtain enough memory when needed. That may be a problem.
With our new scheduler, that should come online soon, you could submit jobs and reserve resources. For example, if you have a job that during startup needs 2GB of memory for 30 minutes and then ramps down to 512 MB for the rest of the program … the scheduler can be informed of such. It will then not schedule any other jobs that potentially sets up a conflict and exhausts available memory. This flag is bsub -R “resource_reservation_parameters” …
The opposite scenario can also occur. That is you may have 8 jobs assigned to a single host. If each job requires lets say 100 MB of memory, the node is flagged as “Full” but has roughly 4GB - 800MB or 3.2GB of idle memory. If all the jobs are memory intensive and there is no IO problem, it may then make sense to raise the number of job slots for that node. This is a practice called overloading.
At a training session i was told that Platform engineers have encountered overload ratios as high as 4:1 … at a bank were all jobs were very homogeneous, had identical run times, and small memory footprints. This practice allows you to raise the total job throughput of your cluster. As long as machines refrain from excessive swapping activity this is a viable approach. Then engineers warned though to not go beyond ratios of 2:1 unless you need what you are doing.
Our Case
On our cluster I have noticed this scenario. Lots of jobs (primarily from physics) require very small memory foot prints. Hundreds are run at the same time. This fills the 16-lwnodes queue which has a total of 16*8 or 128 cores (job slots) available. Yet the nodes, when “Full”, were reporting 3+GB free each.
So we started an experiment. In the following file we raise the number of jobs slots per node to a total of 12 instead of the default 8.
- lsb.hosts
HOST_NAME MXJ   r1m     pg    ls    tmp  DISPATCH_WINDOW  # Keywords
...
# overload -hmeij
#compute-1-17.local     12    ()        ()      ()   ()   ()
#compute-1-18.local     12    ()        ()      ()   ()   ()
#compute-1-19.local     12    ()        ()      ()   ()   ()
#compute-1-20.local     12    ()        ()      ()   ()   ()
#compute-1-21.local     12    ()        ()      ()   ()   ()
#compute-1-22.local     12    ()        ()      ()   ()   ()
#compute-1-23.local     12    ()        ()      ()   ()   ()
#compute-1-24.local     12    ()        ()      ()   ()   ()
#compute-1-25.local     12    ()        ()      ()   ()   ()
#compute-1-26.local     12    ()        ()      ()   ()   ()
#compute-1-27.local     12    ()        ()      ()   ()   ()
#compute-2-28.local     12    ()        ()      ()   ()   ()
#compute-2-29.local     12    ()        ()      ()   ()   ()
#compute-2-30.local     12    ()        ()      ()   ()   ()
#compute-2-31.local     12    ()        ()      ()   ()   ()
#compute-2-32.local     12    ()        ()      ()   ()   ()
# default defines for all hosts, a ! means job slots equal cores
default             !    ()     ()      ()   ()   ()
...
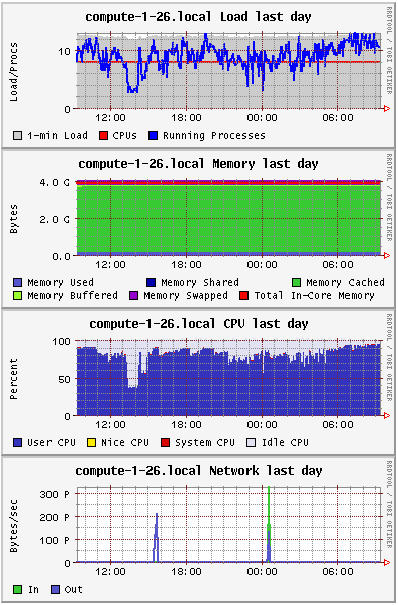
And the scheduler complies, and allocates more jobs as they come in. Yet even with 12 jobs, the node is barely swapping and still lots of memory is available. Notice the io rate (kb/sec averaged over last minutes of activity) and ut (CPU utilizations averaged over last minute, ranges from 0 - 100%) below. So this host is able to handle these jobs fine. We could probably even go to a ratio of 2 or 3 to 1.
[root@swallowtail ~]# lsload -l compute-1-26
HOST_NAME       status  r15s   r1m  r15m   ut    pg  io ls    it   tmp   swp   mem
compute-1-26        ok  10.1  12.6  12.7  95%   7.7  303 1    24 7136M 3802M 3722M
Memory
The graphs below come from the tool Ganglia
Platform LSF considers Available Memory = Free Memory + Buffered Memory + Cached Memory. I'm not clear on why cached memory is so large with low memory demands ( i should ask Dell engineers sometime). But cached memory is available to currently running processes.
SIDEBAR: Don't be fooled by the output of top and other procps programs. They consider cached memory as “used” hence the output of top would show a node with only 17 MB free. Quite the opposite. A known “feature” of procps 3.x.
[root@compute-1-26 ~]# top -b -n1 | grep ^Mem

compute-1-26:
Mem:   4041576k total,  4024572k used,    17004k free,    64112k buffers
Memory, again
 Another item i should dig into sometime is the following question. If i have 8 cores and 4x1GB DIMMS in a PowerEdge 1950 server, can a single core access all memory?
I know there are 2 channels to the memory bank, one for each quad core chip. The DIMMs need to be installed in sets totalling 2, 4 or 8 DIMMs. This is done in a certain way to assure each channel has the euivalent number of DIMMs. Or so the manual says.
But how is memory actually mapped to the cores? Stay tuned.
Or you can read Multi Core Computing


