This secton focuses on some debugging tools which are pretty nifty in understanding message passing. In order to use them, another flavor of MPI is introduced. Sorry. Good news is, OpenMPI is trying to replace them all.
⇒ This is page 3 of 3, navigation provided at bottom of page
LAM/MPI
LAM/MPI is now in maintenance mode but we'll use it for the debugging tools here. It works slightly different than the other MPI falvors we've used so far. Like OpenMPI and TopSpin, it sets up daemons that talk to each other via message passing. However the mpirun command does not start those daemons, you must start them manually.
There is a script /share/apps/bin/mpi-mpirun.lam that will do all this for you when you submit your code to our scheduler. However, in order to understand the sequence of events, this example will do it all via little scripts. LAM/MPI is installed in /share/apps/lam-7.1.3 compiled with gcc/g95. Not against the TopSpin infiniband libraries. Sorry, i'm getting lazy.
In order to start our daemons we need a machine file again. Like below. In this case we'll use swallowtail as the collection worker for XMPI (first one listed) and assign 8 workers on both hosts in the GigE-enabled nodes of the debug queue. They are all on the 192.168.1.xxx network.
- file: machines-debug
swallowtail.local
compute-2-31
compute-2-31
compute-2-31
compute-2-31
compute-2-31
compute-2-31
compute-2-31
compute-2-31
compute-2-32
compute-2-32
compute-2-32
compute-2-32
compute-2-32
compute-2-32
compute-2-32
compute-2-32
We'll create a startup and shutdown script for the daemons, like so:
- file: lam.boot
#!/bin/bash

export ROOT=/share/apps/lam-7.1.3
export PATH=$ROOT/bin:$PATH

lamboot -d ./machines-debug -prefix $ROOT
- file lam.wipe
#!/bin/bash

export ROOT=/share/apps/lam-7.1.3
export PATH=$ROOT/bin:$PATH

wipe -v ./machines-debug
Note when we 'boot' or 'wipe' the LAM space, we simply point it to the “machinefile”, also called a schema, but mpirun has nothing to do with it. After starting the daemons, we have 9 daemons running: one on swallowtail connected to 16 daemons on the compute nodes in question. One of those back end daemons is worker 0. The grand duke. See below.
[hmeij@swallowtail xmpi]$ export PATH=/share/apps/lam-7.1.3/bin:$PATH

[hmeij@swallowtail xmpi]$ ./lam.boot
...lots of info on started daemons...

[hmeij@swallowtail xmpi]$ lamnodes
n0      swallowtail.local:1:origin,this_node
n1      compute-2-31.local:8:
n2      compute-2-32.local:8:
Finally what we need to do is compile a program with LAM/MPI to observe while it is running. We'll use Galaxsee again and compile it with mpicc in the LAM installation. You can use the copy in ~hmeij/xmpi if you wish. It will be an interactive session so please quit it when you're done.
XMPI
XMPI is a graphical user interface for running MPI programs, monitoring MPI processes and messages, and viewing execution trace files. It is simply fun. There are others like the commercial TotalView or DDT and the open source GNU gdb. You can also debug your MPI program by compiling with the gcc flag -g (get it? stands for debug). Or put lots of irrate printf statements in your code.
So start xmpi by pointing it to your LAM schema. Again, a little script so we don't forget the syntax.
- file: lam.xmpi
#!/bin/bash

export ROOT=/share/apps/lam-7.1.3
export PATH=$ROOT/bin:$PATH

xmpi ./machines-debug
Once we start it we get a window like:
- Go to Application | Build & Run
- Click Browse and select Galaxsee
- In Args field type '1000 400 1000 0'
- In Copy field type '16'
- In right panel highlight our n1 & n2 worker units.
- Click on Run
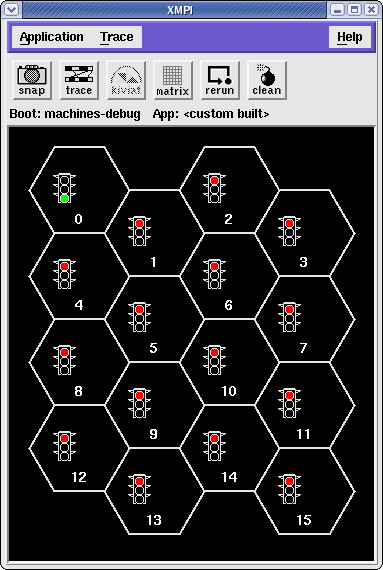
XMPI runs the program, collects a bunch of information, and displays the results. Pretty fast, eh? You now have a window like this:
Swallowtail's daemon represents each daemon in a beehive hexagon. Worker 0 is the head worker. This worker will broadcast “hey all, check in please and get your work assignments”. Worker 1-15 do that, calculate the planet bodies movement, and report the result back to worker 0. And the process is repeated for each time unit.
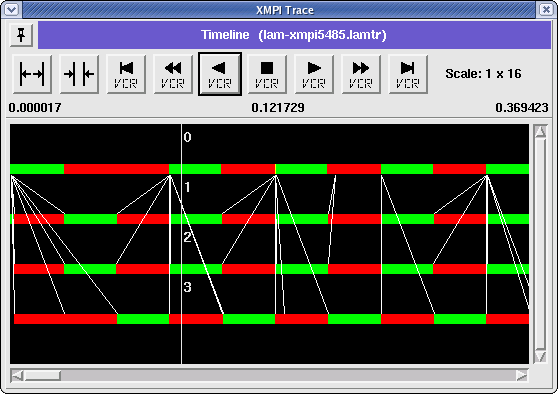
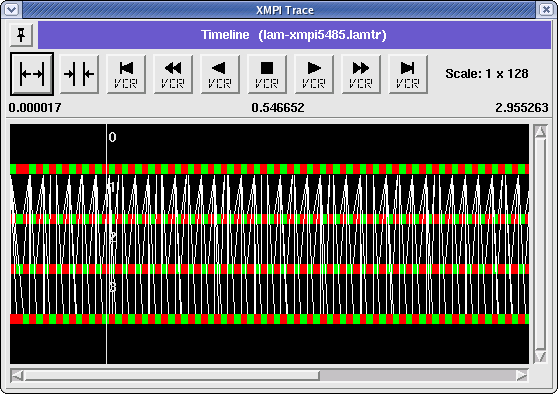
For clarity we'll use 4 workers from now on. Once the program has run, click 'Trace', which collects all MPI events. Use the VCR controls ![]() and get a readable window. Green represents running, red represents blocked waiting on communication and yellow represents time spent inside an MPI function not blocked on communication (we call this system overhead time as it typically represents time doing data conversion, message packing, etc). White lines indicate messages being passed.
and get a readable window. Green represents running, red represents blocked waiting on communication and yellow represents time spent inside an MPI function not blocked on communication (we call this system overhead time as it typically represents time doing data conversion, message packing, etc). White lines indicate messages being passed.
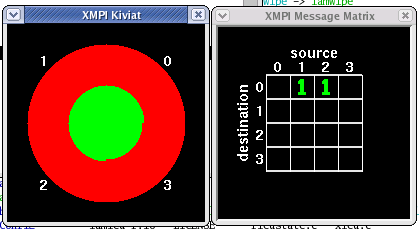
Notice how much time is actually spend in “blocked state” despite parallel processing. There's an art to it i'm sure. We can get a composite view of the total time spend across nodes with the Kiviat tool at any point in time. We can watch message passing (to / from) with the Matrix tool at any point in time. Or animate either tool until we find something odd.
And there's much more. Go to this detailed description for an in depth discussion.
If you want to run this demo, go to ~hmeij/xmpi and simply
- ./lam.boot
- ./lam.xmpi
- go to Application | Browse & Run | select “4workers”
- or build your own via the Build & Load steps decribed above
- enjoy
- exit xmpi
- ./lam.wipe ⇐ don't forget!
You can save these runs for later viewing. Nifty. So my question is why does OpenMPI or TopSpin not have tools like this? Dunno.
⇒ go to page 1 of 3 of what is parallel computing ?

