cluster:210
For other years view: 2020, 2019, 2018, 2017, 2016, 2015, 2014, 2013, 2012, 2011 …
2021 Queue Usage
/* import total into work.one */


/* import total into work.one */

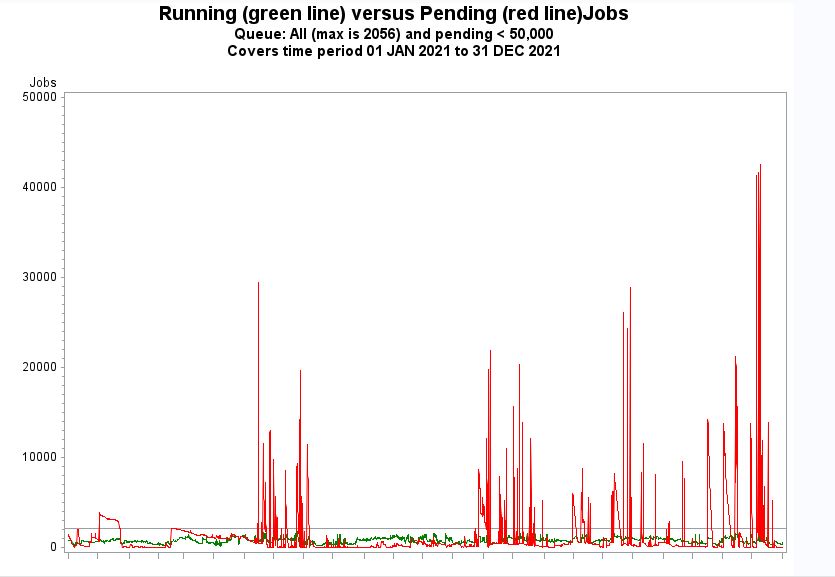
data two; set one; if var2 eq 'total' and var3<50000; run;

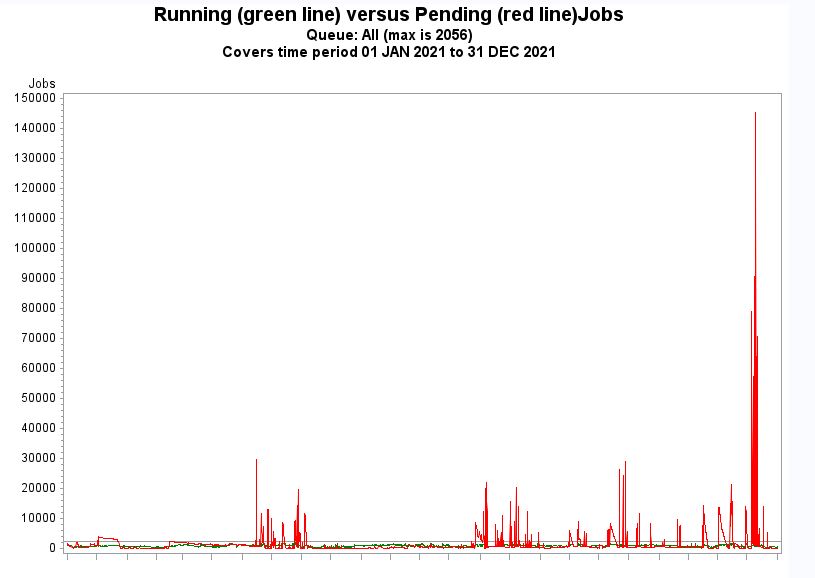
title1 j=c 'Running (green line) versus Pending (red line)Jobs';
title2 j=c 'Queue: All (max is 2056)' and pending < 50,000;
title3 j=c 'Covers time period 01 JAN 2021 to 31 DEC 2021';

axis1 label=("Jobs");
axis2 label=none value=none;

symbol1 interpol=join value=none color=green;
symbol2 interpol=join value=none color=red;

proc gplot data=two;
  plot var4*var1 var3*var1 /
  haxis=axis2 vaxis=axis1 overlay vref=2056;
run;
quit;
cluster/210.txt · Last modified: 2022/01/03 15:14 by hmeij07


